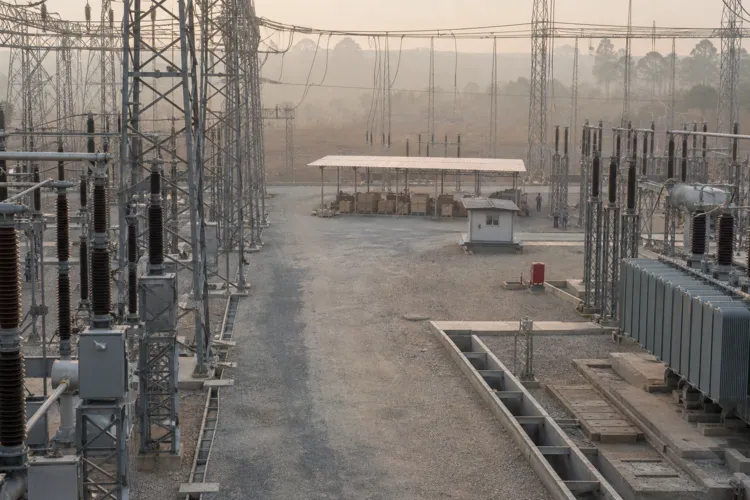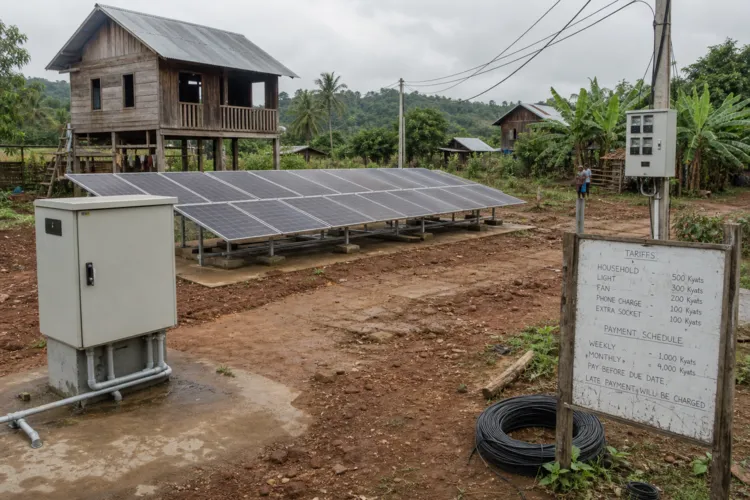
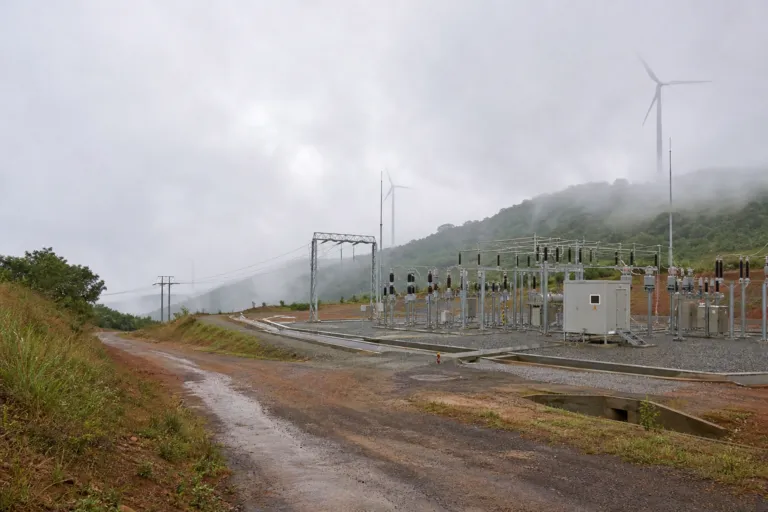
Wind power development in Myanmar is increasingly framed around diversification needs and site-level feasibility rather than large disclosed project numbers. Myanmar’s projected electricity demand is 14.542 GW by 2030, and its Intended Nationally Determined Contribution (INDC) targets solar and wind energy to contribute 9% of total installed capacity. Against that backdrop, the Myanmar wind energy market in 2026 is best read as an early-stage pipeline shaped by resource screening, permitting, and EPC execution realities, with developers balancing ambition against practical constraints.
Peer-reviewed assessment of five favourable locations supports a more detailed view of wind potential. Coastal Sittwe is highlighted for high energy potential, but it also has greater interannual variability, measured at 9.10% IAV. In contrast, inland locations such as Wundwin are described as exceptionally stable, with IAV below 5%. This mix matters for 2026 project planning because pipeline maturity often depends on bankable wind yield expectations and volatility management, not only on identifying windy areas. The same research notes that Myanmar does not possess the strongest wind resource potential compared with other renewables, which increases the value of careful site selection.
What 2026 Pipeline Planning Can Learn From Global Wind Market Signals
Global market indicators provide context for financing and technology expectations that can influence local decisions, even when Myanmar-specific capacity additions are not publicly quantified. One global report values the wind electricity market at $208.24 billion in 2025 and forecasts $229.69 billion in 2026, then $334.77 billion by 2030, with a stated 9.9% CAGR for 2025–2030. A separate global wind energy market report cites growth from $139.68 billion in 2025 to $155.42 billion in 2026 and projects $237.72 billion by 2030. These figures are global, not Myanmar-specific, but they signal sustained investment momentum, alongside trends such as efficiency and reliability improvements tied to sensor-based technologies.
Technology and project type trends also help frame what a realistic 2026 pipeline could prioritize. Globally, onshore installations held 92.45% market share in 2025, while offshore capacity is forecast to grow at a 15.62% CAGR through 2031. Utility-scale projects accounted for 88.05% of global market size in 2025, indicating that large projects dominate where grids and procurement structures can support them. Asia-Pacific led with 53.55% of global capacity in 2025 and is projected to progress at an 11.42% CAGR through 2031. For Myanmar, these are comparison points only, but they reinforce why near-term development may focus on onshore and utility-scale pathways when feasible.
Finally, Myanmar’s broader power generation EPC environment shapes how wind projects move from prospecting into construction. Market commentary describes Myanmar’s EPC sector as facing pressure from feed-in tariff recalibration and sovereign financing constraints, which can extend timelines and compress margins. It also points to the Ministry of Electricity and Energy and the national environmental regulator as key actors shaping approvals, while the Electric Power Generation Enterprise enforces grid code compliance for interconnection standards. For 2026, this suggests a pipeline that advances through tighter feasibility work, clearer grid studies, and sequencing that matches approval pathways, rather than relying on headline MW announcements.
What does research say about Myanmar’s wind resource stability at key sites?
What is Myanmar’s electricity demand outlook and how does it relate to renewables?
How should investors interpret the Myanmar wind energy market in 2026 if few MW figures are disclosed?
What global wind market signals are relevant as context for 2026 planning?
Which global wind segments dominate, and why does that matter as comparison for Myanmar?